People Felt the Recent Economy was the Worst in Recorded History of Consumer Sentiment
And it's puzzling as to exactly why this is
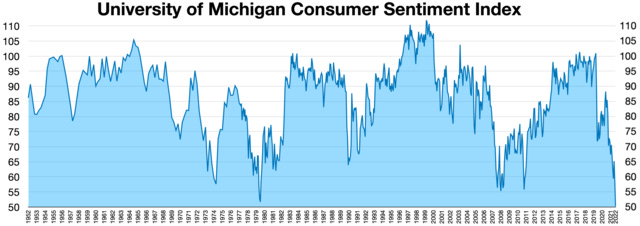
I noticed a curious thing as I was looking over the recent Consumer Sentiment Index report that was released by the University of Michigan on Thursday, March 28. The headlines read that this index increased to 78.4 in March, the highest reading since it was 79 in Aug 2021, roughly 2.5 years.
Upon examination of the graph of the last 50 years of the index, I noticed that the gap between the lines during the troughs looked pretty wide during the recent economic period, compared with notable examples of economic turmoil in the last 50-60 years, such as the Great Recession of 2008-2009, and the “Stagflation” period in the late 1970s and early 1980s. Here’s the graph below (the gray areas indicate recessions):
I examined the data more closely and it turned out what I was seeing was a legitimate phenomenon. According to this index, consumers definitely had negative sentiments for a longer sustained period of time compared to other historical challenging economic periods.
In and of itself, this isn’t too surprising, although it has been a bit mysterious as exactly why people have had such lingering negative sentiments about today’s economy when the macro-economic indicators are quite better than in those other challenging periods.
What was surprising was how long people have felt this negative during this recent period compared to the others. The recent period of 2022 to the present contains the third longest period of time that the index was below 80: 32 months and counting (although likely to go above 80 in the next month or two), compared to 59 months during the Great Recession, and 54 months during the Stagflation years.1
But even more intriguing is that this same recent period was the longest period of time that the index was below 70! For 25 months, from December 2021 through December of 2023, the index was below 70, the longest period of time ever below that threshold. The next longest was the Great Recession at 19 months and the Stagflation era at 18. To be fair to the misery of Stagflation, however, if it wasn’t for a few blips of over 70 for a few months here and there, it would have a longer period of consecutive months below 70. but the numbers are the numbers, and the bottom line is that it did rise back above 70 intermittently during that time.
So this suggests that, in the last 64 years, people have never felt worse about the economy than they had recently.
This bears out in the absolute numbers as well. The lowest index figures ever recorded were 53.2 and 53.3 in August and July 2022, when inflation reached its modern peak. The only other month that went below 54 was May 1980 when it sunk to 53.6.
Other indicators show the same thing. The longest streak of below 60 is also during our recent time, when it reached those levels for seven consecutive months in 2022. The next longest consecutive streak was five during the Great Recession.
The average index number during the sub-70 and sub-80 periods are also the lowest from recent years versus the previous ones.
The 2022-2023 sub-70 average number was 62.58, and the 2022-present sub-80 average is 65.13.
The Great Recession sub-70 average was 63.15 and the sub-80 average was 68.91.
The Stagflation sub-70 average was 66.6 and sub-80 average was 68.1.
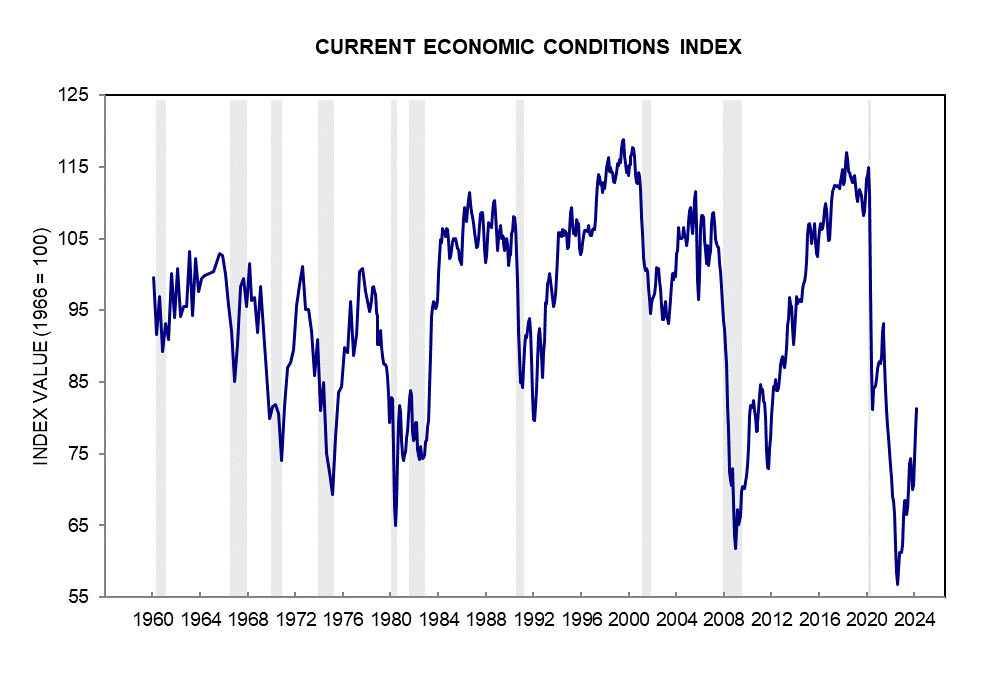
One aspect of the Consumer Sentiment measure is the Current Economic Conditions index, which measures how consumers feel right now (as opposed to how they expect conditions to go in the near future, which is the other aspect of the Consumer Sentiment Index). This index was unequivocally recently the worst in its history, and perhaps displays most clearly how bad people felt recently:
As you can see, the troughs are obviously lower than ever.
It’s still not clear exactly why recent economic sentiment was so bad
As I mentioned above, what struck me was not so much that there’s been significant negative economic sentiment recently, that can be seen in polls everywhere, including this index. But the intensity of the negativity was surprising, when compared to other modern historically challenging periods.
I might have figured the most recent would rank in the top 5 worst periods of negative sentiment. But to be the worst in the history of the index, no matter how to look at it, is very surprising, especially considering the macro-economic indicators that show one of the best-functioning economies in modern history. When one looks at job growth, unemployment, wage growth, etc, one sees a very historically strong economy.
Even inflation, which gets cited as the main culprit at its peak in 2022 wasn’t near as bad as it was in the Stagflation period, although it was the highest since that time. But the recent inflation was short-lived and has recovered relatively quickly and has been at more historically normal levels for several months now.
Since inflation in 2022 was the worst since the Stagflation period, it does indicate that high inflation is perhaps the least tolerable factor among a population than other economic factors. But even here, we see that the recent high was not as high as it was in the Stagflation period (see below graph). Plus, recent inflation was short-lived, has recovered relatively quickly, and has been at more historically normal levels for several months now. So why are people feeling worse now than they did then?
Could it be housing costs? This has been a major culprit in the inflationary trends of recent years. Home prices and interest rates skyrocketed during the initial post-pandemic period of 2022, causing home buyers to have to pay much more for their mortgages than they had in many years. Rent prices also rose sharply during this time due to these pressures. But look at this chart below, which shows the costs of shelter over time, as a measure of year-over-year percent change, basically an inflation measure for shelter.
Yes, shelter inflation has risen sharply recently, but it was much worse during the Stagflationary period, very similar to the regular CPI figures above, but even more extreme in its differences between the two periods. Again, this might explain why consumer sentiment numbers are bad, but not necessarily why they are the worst in the last 64 years.
Another culprit that gets mentioned a lot is housing affordability, or how affordable buying a home is to a regular person when accounting for their income, as opposed to focusing on the rate of change of shelter costs. Okay, let’s look at that, too. In the below graph, the higher on the graph the less affordable housing is.
This particular measure does align more closely with the sentiment measures, as it shows affordability challenges close to the Stagflationary period, but Stagflation was still worse than recently. Once again, the only indicator that suggests that now is the worst time in the last 64 years is the index that measures how people feel, not how things actually are.
The unique traumas of the 2000s
Perhaps there’s a psychological component to this. Young adults coming of age in the 2000s have not had it easy. It can definitely be argued that the Stagflationary period the Baby Boomer generation came of age in was very challenging, on paper perhaps the most economically challenging of the post-World War II period. But when you look at jarring economic and political events, the misery of Gen X and Millennials can certainly give Boomers a run for their money.
There was the historically close 2000 presidential election, world-shifting terrorist attack of Sept 11, 2001, the cataclysmic Hurricane Katrina in 2005, the Great Recession of 2008-2009, the political reality-altering era of Trump and MAGA in 2015-present, and Covid Pandemic of 2020-2022 (there’s really not a specific end date here, but this period was the height of the panic).
That’s a lot to deal with for a generation. Boomers had a lot to deal with, too (Watergate, Gas Price shocks, etc.), but it’s hard to match the acute national traumas of these recent events in a 24-year period. The 1960s might be the closest example, but the Boomers were coming of age soon after the 1960s, they weren’t quite in their working primes at that point. GenX and Millennials were all at some stage in their working primes during the first quarter of the 21st Century.
Inflation and Rate Acceleration and Comparative Considerations
Several months ago, I wrote an article (“What’s Going on With the Economy?”) that examined this in some detail, and I proposed inflation and mortgage rate acceleration shock as a reason for such recent negativity. The point was that if you measure the rate of change from the trough to the peak of inflation, the recent period’s acceleration was comparable to the Stagflationary period, hence the strong recent negativity even during other macro-economic successes.
But, as also noted in this article, the starting points were different during each era, so perhaps it’s this difference that is the reason for the difference in sentiment. In other words, perhaps it’s what we were used to in this generation versus what they were used to in the previous generation that is the reason for the higher recent negativity.
These levels of inflation and interest rates during the periods preceding Stagflation were higher compared to what they were preceding the recent economic era. Therefore, the shock was greater during our recent time, as we started from a level of relative comfort compared to then. Inflation was recently below 2%, which is barely noticeable. And mortgage rates were below 3%, essentially free money when accounting for inflation. So, a huge shift upward from here was much more shocking than a huge shift upward from the levels of the 1970s Stagflation era (or so my theory goes, at least).
When you throw in the psychological components of recent acute economic and political traumas, it makes more sense why the recent generation of consumers felt the way they did for the last two years. I have yet to hear anything else that makes sense, but I would definitely like to see some comprehensive studies on this issue at some point.
The good news is that sentiment is on the way up, so we can hope that a new era of economic satisfaction is around the corner.
What do you think could be the reasons for such sustained recent negativity?
Prior to March 1978, the index appears to have been conducted quarterly. From May 1973 through Nov 1975 the index was under 80 for 33 months, more than the current period by one month. But I didn’t count this, since there’s no way to determine if month-to-month fluctuations would have edged it over 80. There were some numbers in the high 70s, so it is very possible this occurred. Either way, it was still a sustained period of negative sentiment, similar to others in the history of the index.


What about the impact of media- we live in a very different media landscape than previous economic downturns. Every time I opened my social media or turned on news radio in 2022-23, I heard how awful the economy was. It’s so much worse on the right, where they want people to have a reason to not like Biden (because there really isn’t a reason- he is a good egg.) I’m curious if you think this has any impact. Especially when you look at how the US economy has been stable compared to the inflation in other countries.